Finding how many times a word or a string appears in a series in Google Sheets is not a hard feat. In this article, I want to show you quickly how to achieve this research.
1st Step: Finding Unique Values
The first step in achieving this project is to figure out which are the unique values of the dataset we are exploring.
In my example, I have the list of every team that won the Formula One Championship from 1950 to 2018. My goal is to find which team won the most championships. Because some teams obviously won the trophy multiple times, I need to isolate first a list of team that contains only one of each of the team names.
To do that, we are using the formula =UNIQUE. This is how it works:
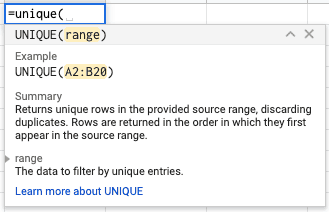
And this is how we are using it with my dataset:
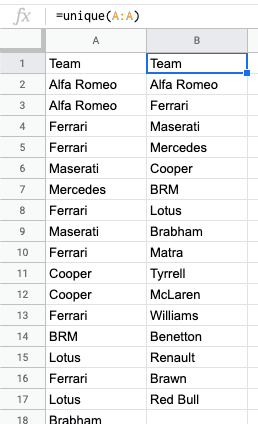
From the 70 different rows I had in column A, the Unique formula found the 16 unique values in my dataset.
Using this formula can also highlight discrepancies in how the data has been collected. For instance, if one of the strings in column A was “Ferrari ” with a space afterwards, the Unique formula would have capture two instances of the word Ferrari. Always think about rapidly checking your column fo unique values in case the data could’ve been collected wrongly.
Final Step: Counting the Occurrences
Google Sheets has the perfect formula to count the number of occurrences of a string in a dataset or column. This formula is called =COUNTIF and this is how it works:
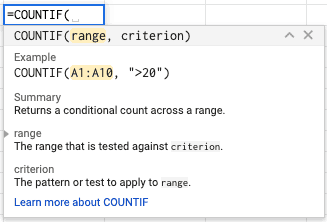
And this is how we would use it in my spreadsheet:
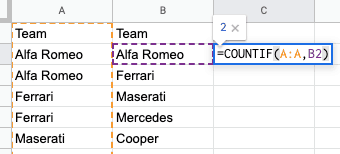
And this is how it looks when we drag the formula to face every unique value:
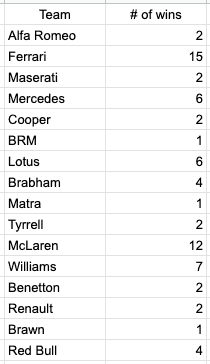
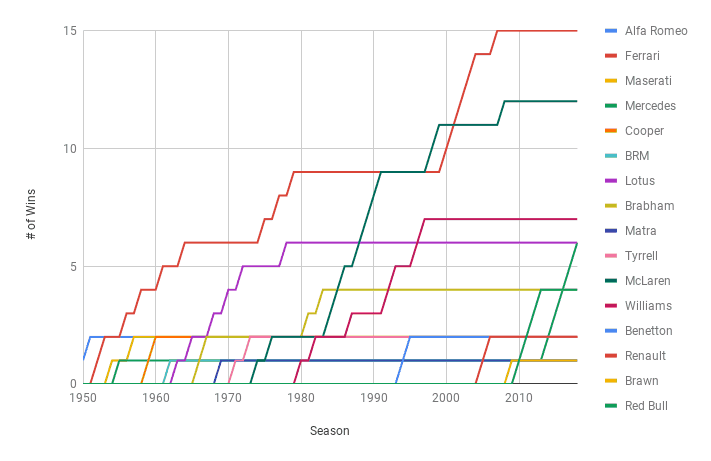
And this is it. We are done here. For entertainment purpose, I allowed myself to share a few of the charts I made to illustrate the dataset I got my hands on regarding this whole Formula one topic.
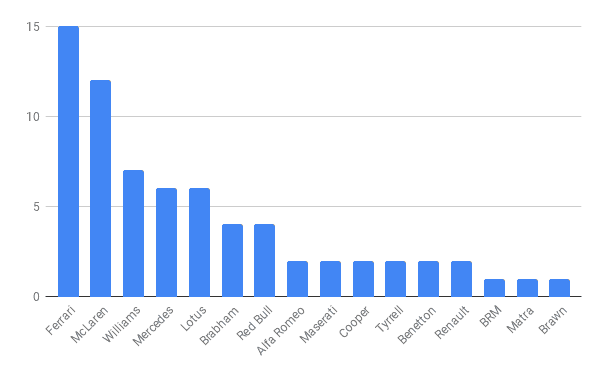
This chart is the one I was looking for before starting this tutorial.
Conclusion
This article is way shorter than usual but it did not warrant more really… If you have any questions regarding this article, please let me know in the comments section down below or send me an email.


