If you’ve ever wanted to track the price and variation of your favourite coins in Google Sheets, you came to the right place. In this article, I am going to show you how you can create a spreadsheet in Google Sheets that will retrieve the price of up to 49 coins and their 24h, 7d and 30d variations. If you just want the spreadsheet, I also included a link to the file down in this article.
The main paradigm of this article is based on this article that I wrote a while back that explains how you can scrape websites with Google Sheets. It has been the base of numerous of my other work and is continuing to inspire my other projects such as this one.
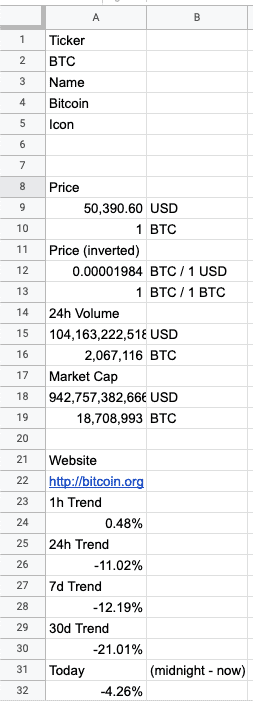
The goal of this spreadsheet is to be able to collect and compare multiple data points from many cryptocurrencies all at once within one Google spreadsheet that will look like this:
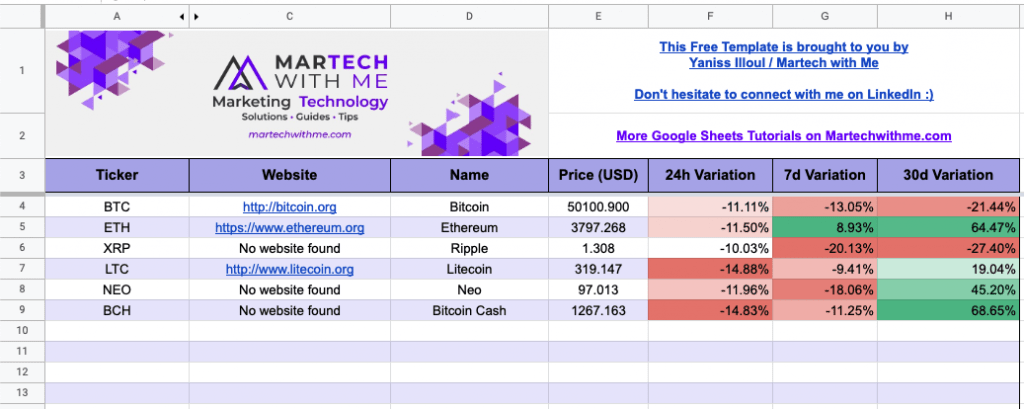
The first column is the only column that requires an input from the user. By putting the ticker of a coin in the column A, the rest of the data points will populate themselves. Overall, it’s quite a simple spreadsheet. So without further ado, let’s build this together.
The IMPORTXML formula
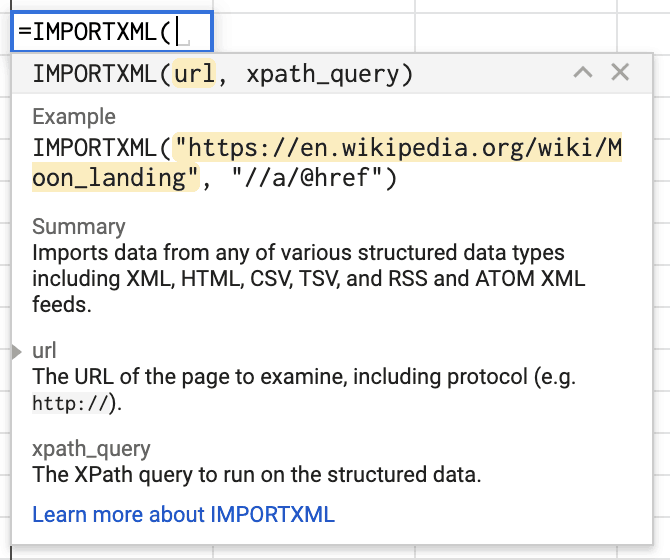
I’m going to plug this article again. But if you are interested in collecting data from almost any website on the web to a Google Sheets’ spreadsheet, you need to learn about the formula =IMPORTXML . I wrote an extensive article about it that has been viewed by multiple thousands of people over the years so I highly suggest you take a look at it if you’re interested, but you don’t need to read it if you’re just interested in the topic of this article.
The IMPORTXML formula is a formula exclusive to Google Sheets that gives a spreadsheet the ability to retrieve data from the source code of any non Javascript rendered webpage on the internet. In order to know what the IMPORTXML formula can scrape off a website, simply head over to the page you’re interested in scraping and turn off JavaScript. If you’re use a Chrome-based browser, you can simply do so by clicking on the small lock next to the URL in your address bar, then on “Site Settings” where you’ll find a Javascript dropdown menu.
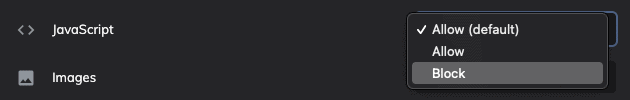
Simply click on “Block” and reload your page and you should see some elements that have disappeared and some elements of the page that are still there. The elements that are still visible are the ones that the IMPORTXML formula is going to be able to extract and import in your Google Sheets.
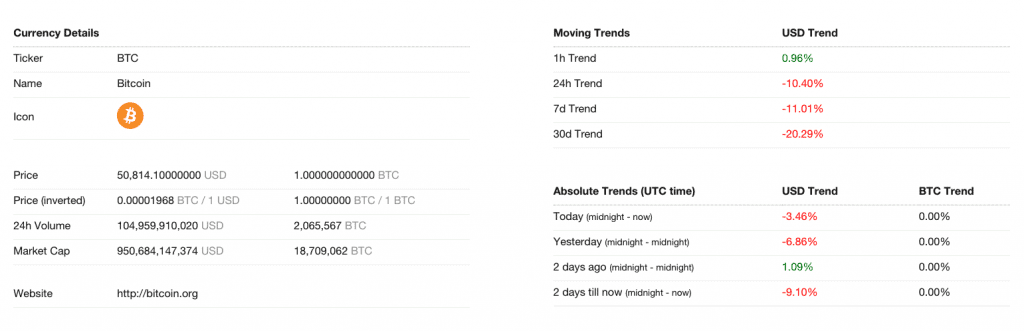
In this tutorial, we are going to extract data from a popular and simple cryptocurrency tracker called coin tracking dot info. And this is how the page for the price of BTC looks like with JavaScript disabled:
As you can see, around the bottom of the page, we can find that all of the information we are interested in are perfectly visible. Namely, the price of the coin, its name, its 24h/7d and 30d trend.
In short, the IMPORTXML formula takes two arguments: The URL where the data you want to extract is stored and an XPATH/where in the page the data is stored.
By using the “Inspect” function of our browser, we can narrow down the output of the IMPORTXML formula to only show what we are interested in. So let’s inspect the price of the coin value. Simply hover your mouse over the price of the coin, right-click and select the “Inspect” button. A page full of code should appear at the right of your screen like so:
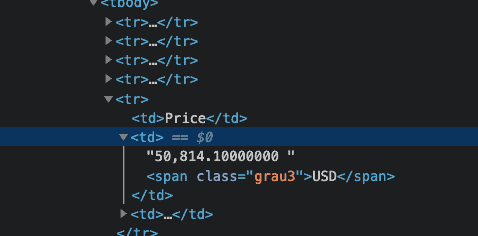
What we are learning here is that the value we are interested in is encapsulated in a HTML tag named “td”. Other websites will be more precise in the way they display data but this is just fine. Our goal now is going to be to retrieve every “td” from this specific webpage and filter the data down to the exact points we are interested in afterwards.
To extract all of the “td” of this webpage, we are going to write this in our spreadsheet:
=IMPORTXML("https://cointracking.info/coin_charts.php?cur=BTC","//td")As you can see, the first variable of the IMPORTXML formula is the URL we are extracting data form. The second argument is the XPATH of our query. Writing “//td” means “Get the content from all of the <td> tag in this webpage, resulting in this output:
Almost like magic, isn’t it?
The rest of the work now is about narrowing this output down to only display the few data points we are interested in.
In order to do that, we are going to use another useful formula called INDEX. This formula allows us to only display a specific cell from the output of another formula by specifying which row and which column we want to show.
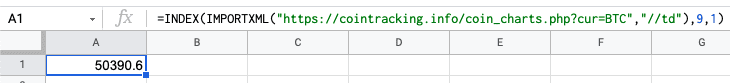
For instance, in our case, we only want to display the price of the BTC coin which is located on the 9th row of the first column of the output generated by our IMPORTXML formula. So we are going to use the INDEX formula like so:
=INDEX(IMPORTXML("https://cointracking.info/coin_charts.php?cur=BTC","//td"),9,1)to only display this cell:
Super Simple!
And now we can repeat this formula for every data point we are interested in and format our columns so it can look pretty to eventually have something that looks a bit like this:
In the case of my spreadsheet, I played a bit with formulas to provide with a more interactive experience. You can inspect the formulas by yourself by making a copy of this spreadsheet: https://docs.google.com/spreadsheets/d/1K2ktmVrJjhR8LviKS4B_dmjr6Ut3EzKemIOmRlbwZ_o/edit?usp=sharing .
The Spreadsheet
For the ones that are only interested in the spreadsheet, head over to this link where you will be able to make a copy of the file that will be hosted in your own Google Drive. Just click on “File” and “Make a Copy” at the top left of your screen.
To use the spreadsheet, simply put the ticker of the coin you are interested in tracking in the column A and watch the other columns populate themselves :).
Conclusion
And that’s pretty much it. I hope you learned something new today or you at least got some value out of this post. If you’re interested in learning more about what you can do with Google Sheets, don’t hesitate to look into the rest of my articles on the topic. And if you’re dabbling in Marketing and are into Technology and Automation, I would really appreciate it if you could consider joining my newsletter where I share insightful articles, tutorials and guides from all over the internet about this field. You’ll find the form to enter the list right down below.
Thanks again for your time.


29 Responses
The formulas worked, but google sheets is not updating as the currency price changes. What did I miss?
this is pretty cool. any idea why it doesn’t work for some coins? examples – DERC, JOE are working fine through the regular browser interface, but not in the xml parse. showing wrong prices altogether.
You may want to try extracting the “td” of your problem coins. I had several alt coins that the data was 1 line off so I had to adjust the formula accordingly.
i.e. The “price” of LIQ was on “line 8” instead of “line 9” so it displayed the price as “0.00”. As well as the 24h Variation displayed “7d Trend” because it was a line off as well.
I used your same formula in my spreadsheet, but in addition to not bringing the same quote, some currencies are coming without value format, as in the case of AXS and LTC.
I even isolated looking only for the data in “https://cointracking.info/coin_charts.php?cur=BTC”, but the value shown is different from what is in your spreadsheet.
Thanks for the tip.
Hey excellent breakdown. I just want to know if its possible to add the sparkle line and bar graph with this same formula? Also would this formula be able to get the Market Cap? Sorry for all the questions but I look forward to your response.
Great work!
But can the format of the sums be converted into European standard somehow? We use decimal commas not decimal points and it crashes all my formulas, when I intergrate this into my sheets.
Also can I switch th currency displayed into Euros?
Thank you!
I am sorry, I mean Solana, not the LTC
HI, unable to see SOL and DOT prices? Can assist?
Entry-level crypto miners can be relatively low price, while top performance Bitcoin miners for sale can range up to over $10,000 to $20,000. When assessing Innosilicon miners for sale with the intent of BTC mining, you will need to weigh up the power of the device vs. the amount of power it draws, alongside the cost of electric current in your area.
Hey man, this formula worked brilliantly for the last year, but something has broken and I’m now getting an error message on most of my coin data “Resource URL exceeded maximum size”. I have no idea how to work around this, so if you can take a look and make an update to this blog post you’re going to make a lot of people happy.
bbyk51
nituei
xrzsg5
eljha3
l14e77
hj86n9
qg1f8w
b4d31o
kkf93b
oh4wb3
c47qsf
v31ihz
ar7hjd
dy9k3o
95jakj
iq7j0g
jq4vc4
ewkkxx
la7usq