Creating a Month over Month or Monthly progress report is vital in order to evaluate the long-term effect of your strategies. This kind of report allows you, as an Email Marketing Manager, to report on the effectiveness of what you implemented so you can make better decisions when planning for your next tests.
Unfortunately, Mautic does not allow for an easy way to make that kind of report and so I decided to share with you how I created my own Google Sheets template that takes a Mautic Report export and grants me with the possibility of evaluating my performance over multiple months in just a few clicks.
NB: This tutorial can also be applied to other Email Marketing Automation tools given that you have the possibility of arranging the columns of your yearly export as I do in Mautic. Feel free to reach out to me if you need any help with that.
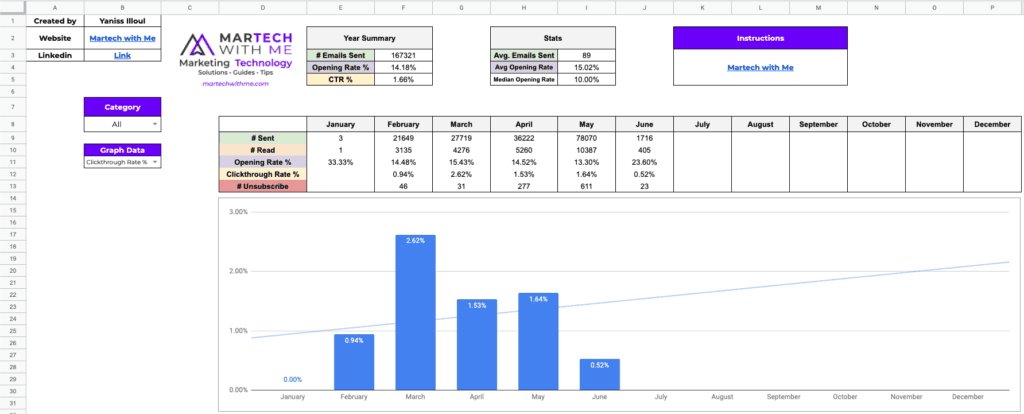
In this tutorial, you will learn how to go from an Email Marketing results export to this dashboard:
Creating the Mautic Report Baseline
If you haven’t read my article about how to create an opening rate report in Mautic, please check it out here. This will give you the necessary knowledge in order to follow this tutorial.
The first thing we want to do is create the original Mautic report that we are going to export and import in our Google Sheets template.
For this particular project, here are the columns we are interested in including in our report:
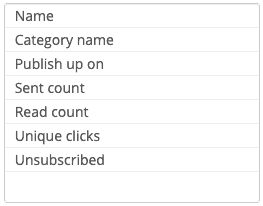
My goal with the Google Sheets Template is to provide a Month over Month progress report based on the category of the emails sent and/or the overall results. That requires you, the Mautic user, to set a Category when you are creating your Broadcast Email.
NB: You do not have to use the Category column. Using Categories allows my company to split our reports. For the purpose of this tutorial, I am using the categories but the Dashboard I’m going to share with you later also has a “All” setting that does not take into account categories, effectively showing everything.
If you are not sure how to do this. You can find the field “Category” in the sidebar located at the right side of your New Email window:
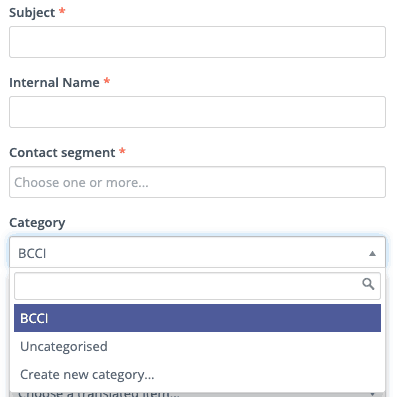
Using the Category field is very practical. If you’re selling products and writing content, for instance, you could have a category “Newsletter” and a category “Promotions“. If you’re writing a lot of content, you could have a category “Weekly Recap“, “Daily Newsletter“, “Monthly Newsletter“. The goal with this template is to easily split the Month over Month report to only show the data of a category of your choice or all of the data at the same time.
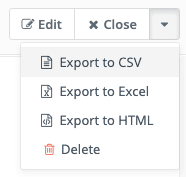
Once you created your Mautic Report, we need to export it as a CSV, using the Export function located at the top-right side of your screen when displaying the report. Don’t forget to set the timeframe to be maximum one year, from January to December. This tutorial is only set to show progress within the same year. In order to show progress from January 2018 to December 2019, you would need to create two of these reports.
Creating our Email Marketing Yearly Report
Now that we have our CSV in hand. It is time to import it in our Dashboard Template. Because it would take me thousands of words to explain how I created this Dashboard, I am just going to share it here so you can make a copy of it and use it in your own Google Drive.
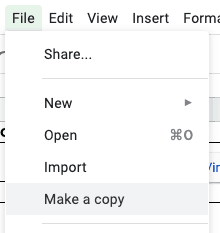
The first thing you want to do here is make a copy of this document. To do so, head over to File -> Make a Copy.
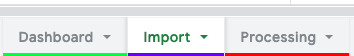
After having saved and opened the copied document in your own Drive, head over to the “Import” tab at the bottom of the spreadsheet.
Now, we need to import our CSV Mautic export in this “Import” sheet. To do so, click on File -> Import and upload your CSV file as “Replace current sheet“. This is an extremely important step.
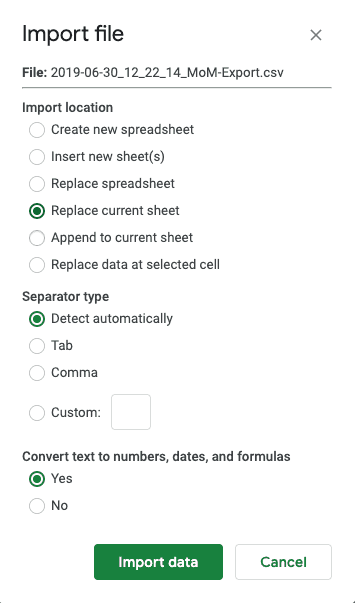
You can then proceed to click on “Import data“.
From now on, you can head over to the “Dashboard” tab of your spreadsheet and start contemplating your data.
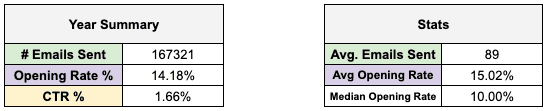
The top of your dashboard summarizes your data. Here you can find the number of emails you sent throughout the year, the opening rate between all of the emails sent and all of the emails received and your clickthrough-rate based on the same emails.
On the right side of your Year summary, you will find the average number of addresses contacted per sendout, the average opening rate of your sendouts and the median opening rate of all of your sendouts.
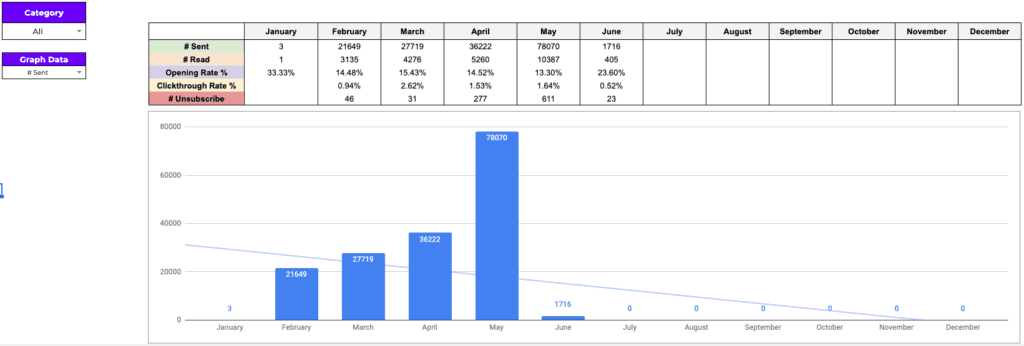
The middle-bottom section is where most of the interesting things are happening. The table in the middle shows multiple things:
- # Sent: Number of Emails sent per month
- # Read: Number of Emails read per month
- Opening Rate %: # Read / # Sent * 100 to get the Opening Rate for every month
- Clickthrough-Rate %: # Unique Clicks / # Sent to get the Clickthrough Rate for every month
- # Unsubscribe: Number of email addresses that unsubscribed from your emails.
On the left side, there is a “Category” drop-down menu you can choose if you want to display the data for all of the emails sent or if you want to focus on one category specifically.
At the bottom of this Category selector, you will find a “Graph Data” selector that will change the data displayed in the chart underneath the Monthly table. You can choose any of the rows that are in the Monthly table to have a visualisation of its progress throughout the year.
Be mindful that the Chart displays the data of the category you choose.
Conclusion
That’s it. If you use Mautic, this template is ready to be used and make creating reports easier. If you use another Email Marketing Automation tool, you will have to adapt the export so it has the same columns in the same order as described in the Mautic export section of this article.
If you liked what you saw, learned something or found this post helpful, please consider subscribing to my newsletter. I will alert you once a week of the new posts I published and give you a reading list of knowledge I think is valuable to my readers.
If you have any questions, don’t hesitate to reach out to me by mail or in the comments section down below.
Thank you for your time!


6 Responses
Nice report and simple to implement. I appreciate you sharing how you use Mautic!
Hey thank you so much for taking the time to be so kind! Your comment is much appreciated 🙂
Thanks for this Yaniss. Really useful dashboard for viewing topline stats.
Hello! Thank you for the super useful article.
I tried to follow all the steps you’ve described but somehow it doesn’t work for me. I faced the problem with the field “Publish up on” and now can see the data for one only month. Could you share the sample template directly with me so that I could see how you form the CSV export file from Mautic?
Sure I’ll send you an email and arrange that 🙂
This is awesome! Just what I was attempting to build. However, since I am not a Mautic customer, I would like to see the import file that you use to make sure I have our report built correctly. How I am setting it up is not working. Can you share that with me? Thanks!