Reporting is at the foundation of any strategy to improve results in any key metrics your team or yourself has set. Mautic benefits from very strong reporting abilities that can reveal their potential once mastered. In this article, I want to write a step-by-step tutorial on how to compile the results of all of the emails that you’ve sent in one pretty dashboard that you can share with your team and draw analysis from.
This tutorial should be compatible with any version of Mautic starting 2.14. I only have two instances, one under Mautic 2.14.2 and the other one on 2.15.1 but it should work retroactively.
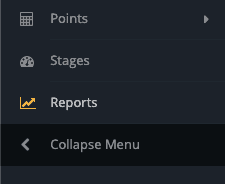
Access your Reports in Mautic
To find the list of your existing reports and create new ones, you need to get to the Reports panel located at the bottom of your left menu.
We will find the “New” Report button at the top right corner of our screen. After having clicked on this button, our instance will direct us to the New Report window.
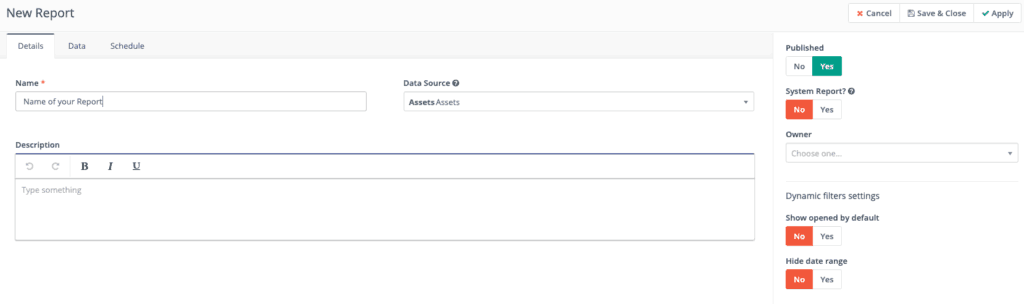
Let’s analyze this screen. Reports are created using the tab “Details” and “Data“. In Details, you will find the general settings of your reports, namely the name of your report, a description of it, what kind of data this report is going to pull from your instance, the privacy settings of your report and its filter settings.
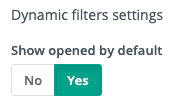
By default, I like to have the “Show opened by default” of the “Dynamic Filters Settings” section enabled. This will be useful when using the final report.
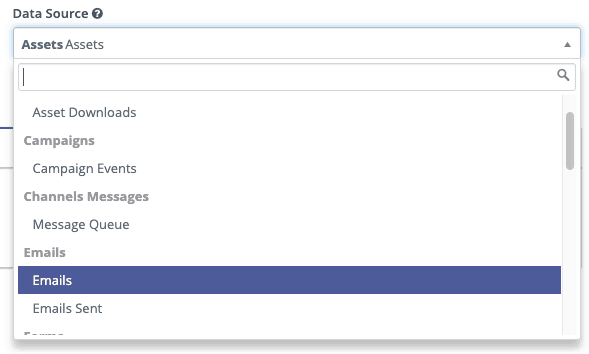
The most important thing to set in this Details tab is the Data Source. In order to be able to pull the data from the Emails we sent using Mautic and their opening rates, we need to select “Emails” as the Data Source like so:
Once this is done, we can finally go to the “Data” tab section of the New Report window. After having selected “Emails” you will notice a new tab “Graphs” appeared. This will come handy in the future but let’s focus our attention on the “Data” tab for now.
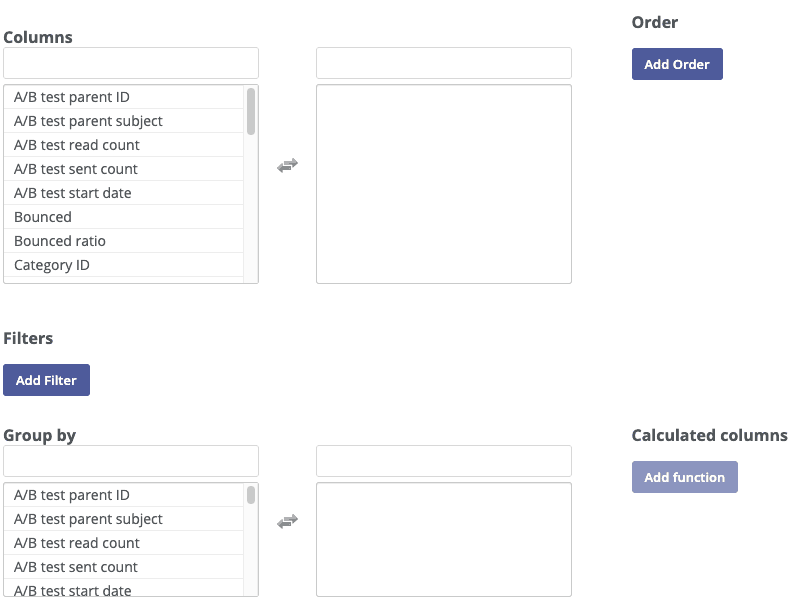
The “Columns” section is where we will select what kind of information we want to display in our report. Everything in “Columns” is every information you can retrieve from your sendouts. In our case and because we want to track opening rates/relative health of a sendout, this is how I would suggest setting your report up:
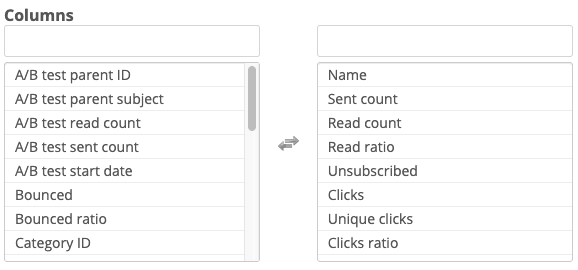
This basically means that for every Broadcast or Campaign email created, we want to display the name of the Email, the number of emails that this Sendout sent, number of times it has been read, its read ratio in percentage, number of unsubscribe, clicks, unique clicks and the click ratio.
From my research, these metrics are the metrics that matter the most in order to evaluate how an email performed.
Now we need to spend a bit of quality time in the “Filters” section. This section enables the possibility to filter depending on specific parameters. For instance, we could filter only the emails that contain the word “Newsletter” in their Name. This is useful if you want to create an Opening rate Report dedicated to your Newsletters sendouts.
You could also filter out all of the sendouts that have a “Send count” below a certain number. The possibilities are pretty vast and you should definitely spend a bit of time playing with these settings but for now, let’s add to our report the possibility of filtering by name.
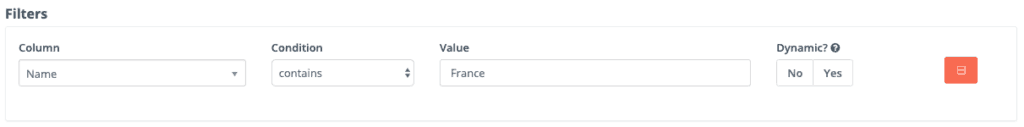
In “Filters“, just click on “Add Filter” and find the “Name” field. In “Condition“, I like to put “contains” so that in the event that I would like to look for Newsletter and that the name of my email was “Newsletter March W1”, it would still display it.
The Value is the word or sequence of words we are looking to monitor specifically in this report. If you want a “Newsletter” report as I mentioned above, you just have to write “Newsletter” in the value field.
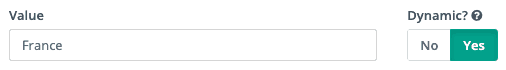
In my case, I will input “France” as a value because I want to make a report that shows me the health of my emails in Mautic in the French market. My Emails are usually named “Campaign Client Country” and in this case, I want to see how France is doing.
If we save and close this report, it should already be able to provide us with some insights:
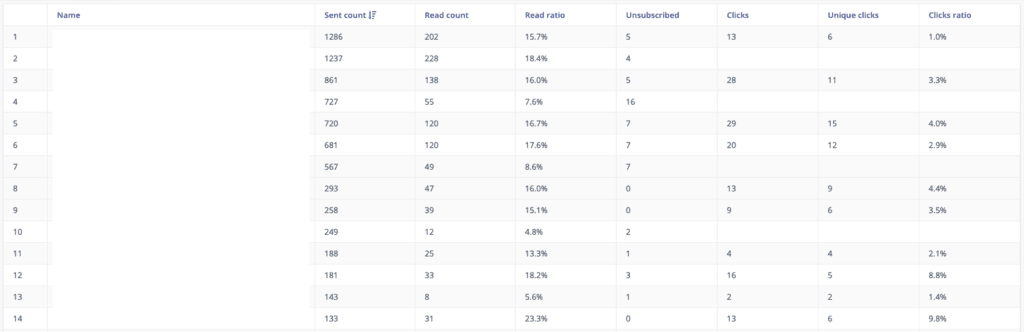
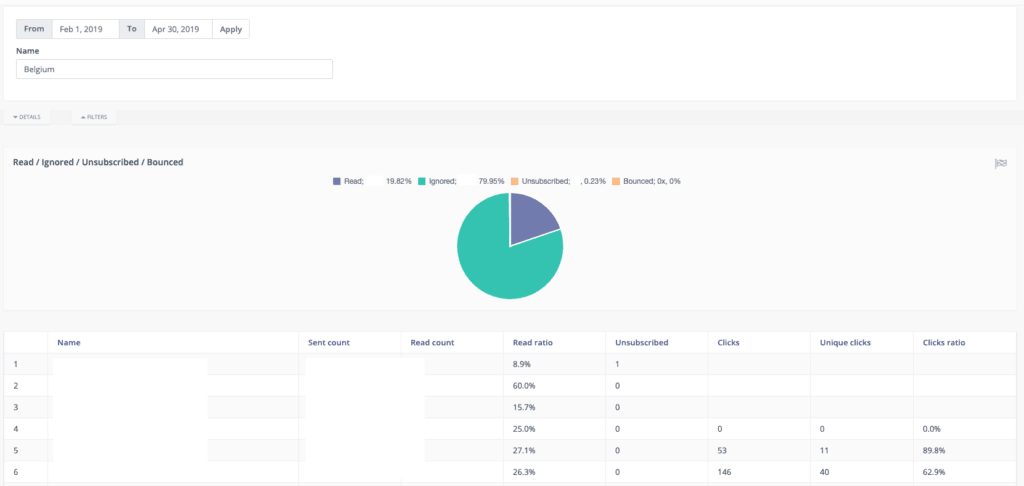
Unfortunately, I can not disclose the name of our Emails as it contains confidential information but for the purpose of this tutorial, believe me, all of the Emails present in the “Name” column have the word “France” in them.
Dynamic Filters in Mautic Reports
Now, I want to explain to you how useful the concept of “Dynamic Filters” is. In this report, if I wanted to change the results and show emails that we sent in Spain for instance, I would have to manually edit the report, change the value of the Filter Name to “Spain”, save and close my report and look at the results. Thankfully, Dynamic filters allow us to change the value of the filter on the fly while looking at the report. To enable this, edit once again your report and find the filters settings.
On the right side of the filter “Name“, you can see a “Dynamic?” setting. Let’s click on Yes there.
Now, when we Save and Close our modifications and go back in the report, a new field appeared at the top of the screen:
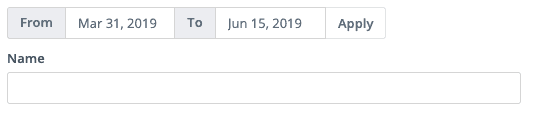
That’s right. Now you can input any “Name” value and press Enter. This will automatically update the report to show you all of the emails that contain the Value you will have written in this Dynamic Filter.
Inserting Graphs in your Mautic Reports
Depending on the chosen Data Source, the option of inserting charts inside of your report will be available. In the case of Emails, one chart is available to display.
If you head over to the Graphs section of your Report Creation tool, you will find all of the graphs that are available to use.
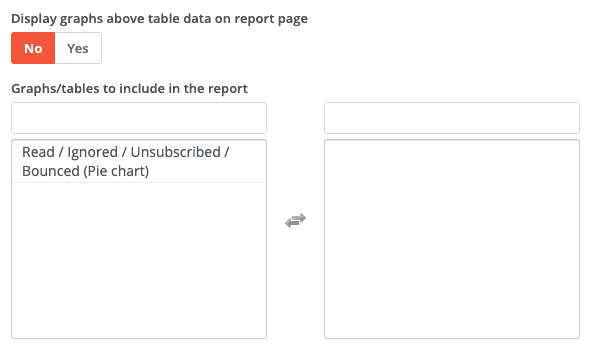
By choosing to display graphs above the table data and by clicking on the “Read / Ignored / …”, this basically ensures that the chart will be displayed at the top of the report.
And this is how our new report looks like:
Conclusion
As i said in my introduction, Reports is essential to monitor the wellbeing of your emails, identify weaknesses and trends in your overall Email Marketing strategy. I use my reports on a Daily basis and I count at the moment 13 different reports that allow me to perform analysis on our campaigns.
If you’re interested in creating a different report, please let me know in the comment section down below and I will spend the time creating a detailed tutorial on how to achieve the monitoring of the metrics you are the most interested in.
In the meantime, if you found this content helpful, don’t hesitate to subscribe to our newsletter. It makes sure you don’t miss any of our next articles 🙂
See you next time,


4 Responses
It would be interesting to see what are the other reports you use.
Hey thanks for the comment!
I can definitely think of one or two more reports I could show on this website. The first one I already shared a tutorial and is a report that allows you to see on which links in your emails people are clicking the most and is available at this address: https://martechwithme.com/create-report-number-clicks-url-mautic/
The other one that I really love analyzing is what I call a Read Delay report which allows me to see on average how long after receiving an email people read it. That’s especially useful when you’re targetting different countries and want to see if some countries take longer to open than others and therefore should maybe receive the emails later to catch the receiver at a better time. I can try and find the time to write something about it if that is interesting enough to you 🙂
Is there a way to include the email IDs/contact names in this report to know who opened the emails and who didn’t?
Thank you for the report!
However I use the same templated email for our newsletters from last year, and I can’t get a per-mailing report generated.
I can only generate a consolidated report since the email was created.
What would you suggest?