Whether you are doing some project analysis or want to track the success of the Kickstarter projects you’ve been funding, there are no ways that I know of at the moment to easily keep track and monitor multiple Kickstarter campaigns within one specific dashboard.
Fortunately, after a few hours of fidgeting, I managed to create my own “Kickstarter Project Tracker” within the Google Sheets software and in this article, I want to show you how I did it and share with you my spreadsheet so you can start tracking Kickstarter projects yourself :). So without further ado, let’s get into it.
The basis of this article really comes down to one of my other tutorials where I explained how you could use Google Sheets to scrape data off websites. Once you have this concept (Tutorial here) narrowed down, it’s really easy to start thinking of ways to apply this knowledge for practical projects. In this case, I thought it would be useful to track how Kickstarter projects are/were doing.
There were a few data points I was interested in capturing with this spreadsheet:
- Name of the Project
- Status of the Project (Live, Successful, Failed)
- Monetary Goal of the Project
- Number of Backers
- Amount Pledged
- Average Amount Pledged by Backer
- And finally, percentage of completion.
The second goal of this spreadsheet was to have all of these data points update themselves at least daily.
Now, obviously, if you are reading this article, this means that I managed to create such a spreadsheet and that I am now ready to share it with everyone. I am going to start with sharing how to use the spreadsheet in the first part of this article before explaining further how I managed to create such a spreadsheet.
The Spreadsheet
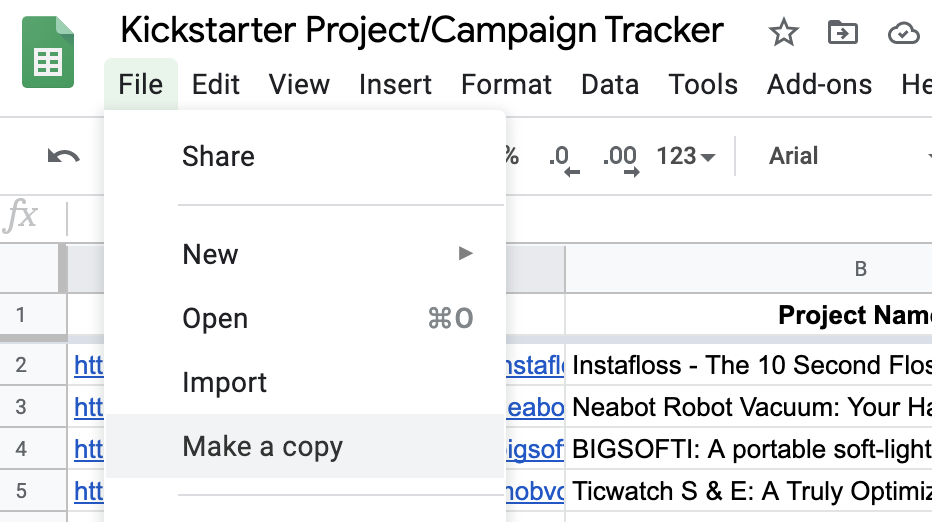
You can make a copy of the spreadsheet by following this link and going into “File” -> “Make a Copy” so you can save the spreadsheet to your own Google Drive.
As you will be able to see once on the spreadsheet, I already put 9 projects I tried the project on to make sure it was working perfectly. You can see that despite the variety of the projects’ status and their original locations, the spreadsheet works really well at tracking in almost real-time all of the metrics I mentioned I was interested in.
Now, there is only one thing you have to input in order to start tracking new projects. The column A is where you have to paste the projects’ URLs. Simply head over to the Kickstarter campaign you are interested in monitoring and copy the URL in your address bar. Make sure that you only copy the URL of the project without any additional information that Kickstarter may add to their URL.
As an example, this project on the homepage has this URL:
https://www.kickstarter.com/projects/gempty/rainy-days-vol-1-the-manga-by-and-for-people-of-color?ref=section-homepage-featured-project
In order for the spreadsheet to work, we are going to want to only keep this:
https://www.kickstarter.com/projects/gempty/rainy-days-vol-1-the-manga-by-and-for-people-of-color
Now that you pasted the URL in the column “Project URL” or column A, the rest of the column is going to populate automatically like so:
And this is simply how it works. All of the values are converted into USD for ease of comparison and you can put up to 100 different projects into the spreadsheet by default. If you want to track more projects, you just have to drag down the formulas in column B to H however far down you want to.
Now that I explained how to use it, I would like to show you how I got to this point. While some of the columns require advanced knowledge of Google Sheets that I would not be able to explain in a short article like this one, I believe I can explain the gist of it within this post.
ImportXML on Kickstarter.com
If you have seen my previous tutorial on how to extract data from websites with Google Sheets, you will know that one of the limitations this method has is that it is unable to retrieve data from dynamically generated websites. Meaning that if you turn off Javascript and can not see the data you are looking to parse, you will have to find a different data source.
Fortunately, I managed to find a way to retrieve the JSON file that was feeding the dynamic aspect of the website. And I will show you how.
But first, as usual for this kind of project, we want to see what is easily parsable and what is not. By going to a project and hitting the website settings button on Chrome, we are able to disable Javascript and have a cleaner view of what is available to us.
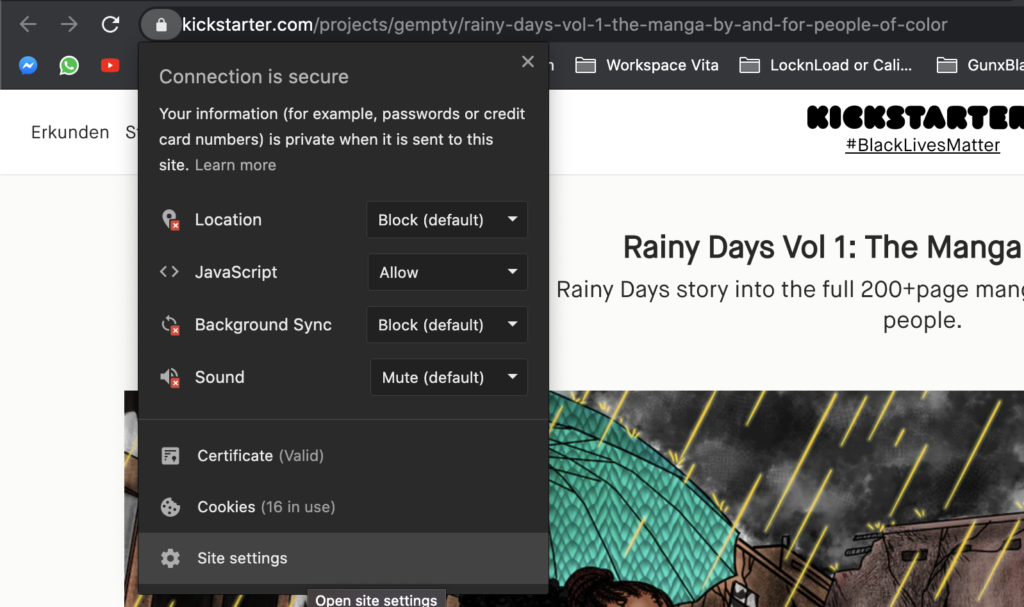
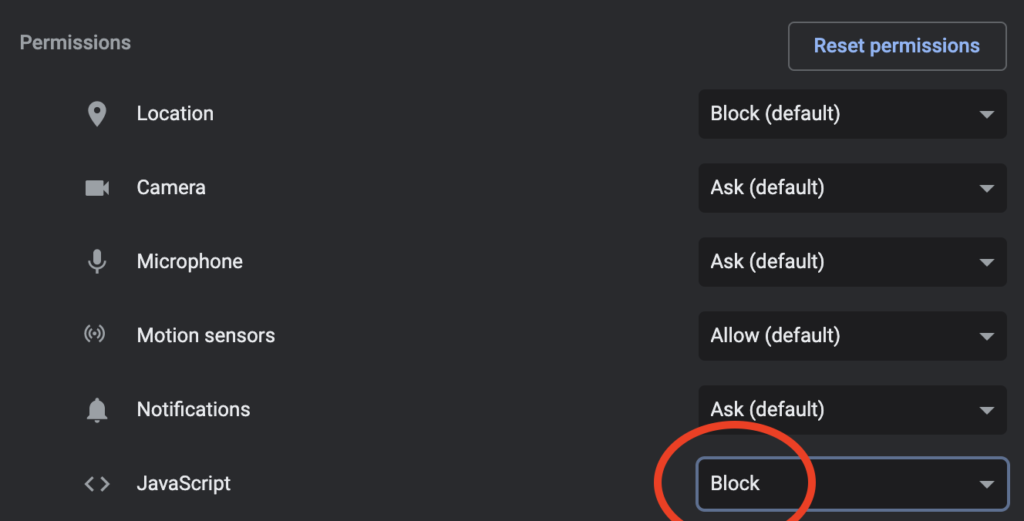
Now that we have disabled Javascript on our webpage of choice, we can see that a lot of the data has disappeared. However, one number that we are interested in, the goal of the project, is still visible and therefore able to be extracted.
In order to do this, right-click on the goal amount and click on “Inspect”. This will open a developers box that will highlight the section where the code is stored, allowing us to craft the formula that will let us retrieve it.
If you are looking at any Kickstarter project, this is what you should see (With obviously a different number depending on the project):
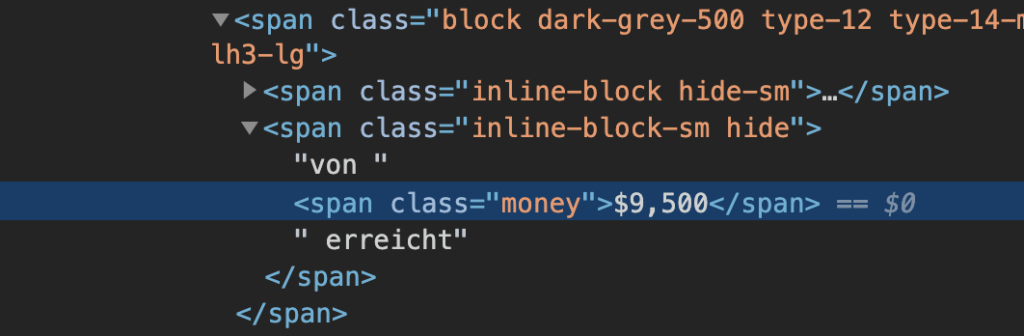
In our case, we are interested in the fact that the HTML tag is a <span> and that the identificator for where the number is stored is class=”money”.
Armed with those information, we can now start building our IMPORTXML formula:
We are going to input this into one of our spreadsheet’s cells:
=IMPORTXML("https://www.kickstarter.com/projects/gempty/rainy-days-vol-1-the-manga-by-and-for-people-of-color","//span[@class='money']")The first parameter of the IMPORTXML formula is the URL. The second parameter is the Xpath Query. This is where we are going to specify what kind of HTML tag we are interested in querying. In our case, writing “//span[@class=’money’]” means that we are interested in retrieving all of the content stored within every <span> HTML tag that contains a class called “money”.
After having validated our formula, you should see something like this:
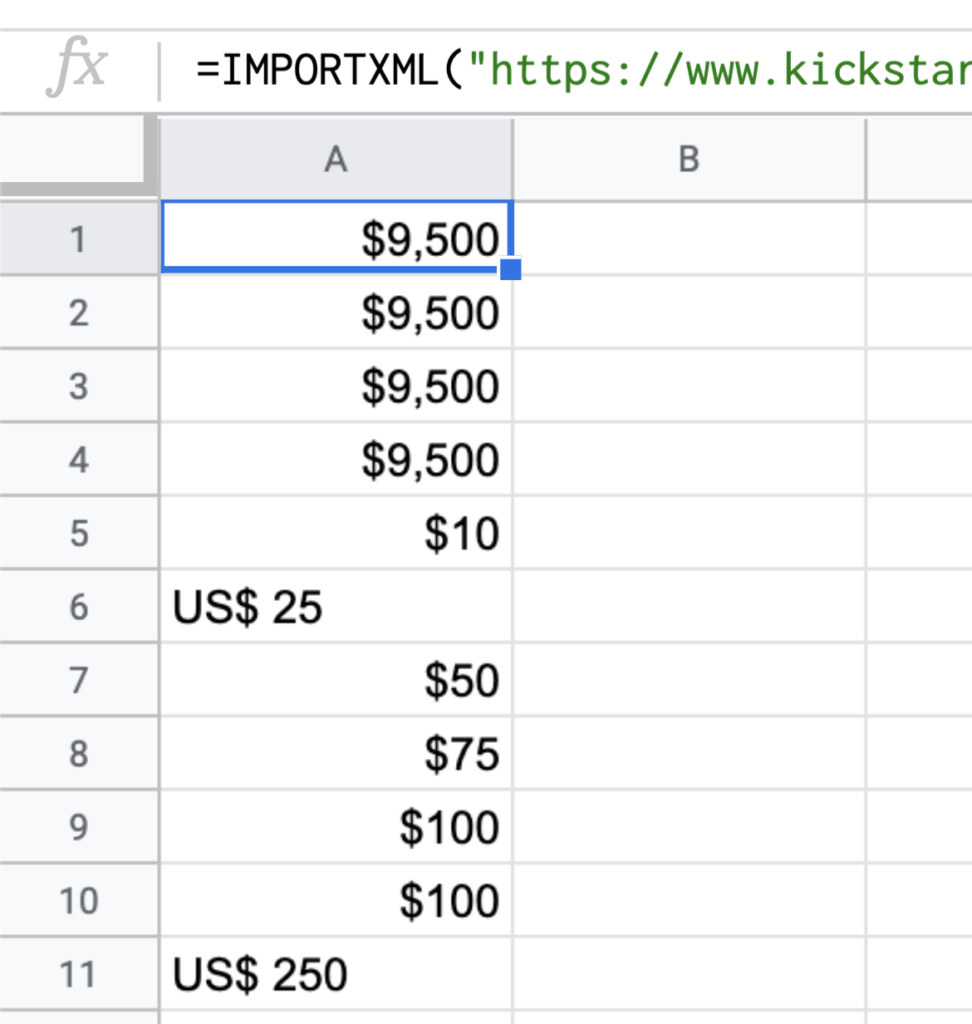
As you can see, this query actually more results than intended but the 9,500$ value is sitting there multiple times. The reason we got that many results is because there are other places in the code of the page that are using the same code syntax as the element we inspected earlier.
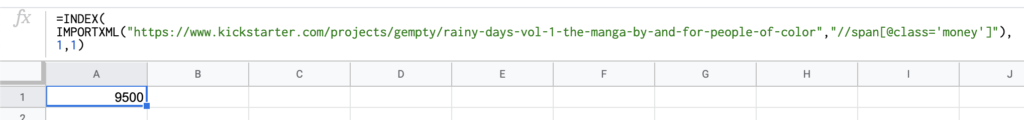
Thankfully, there is a way to ask that Google Sheets only displays the first result. In order to do that, we are going to couple the IMPORTXML formula with an INDEX formula like so:
=INDEX(IMPORTXML("https://www.kickstarter.com/projects/gempty/rainy-days-vol-1-the-manga-by-and-for-people-of-color","//span[@class='money']"),1,1)This INDEX formula stipulates that out of the results provided by the IMPORTXML formula, we only want to see the result in the first row in the first column, effectively rendering just the 9500$ value, like shown here:
And this is how you can easily get the “Goal” column to be displayed in the dashboard. If you look at the formula I used in the actual dashboard, you might notice that it looks a bit more complicated than that. The reason behind the complication is that depending on where the project is originating from, the goal might not be displayed in USD. Therefore, I had to find a way to extract the original currency of the project and convert the goal value into USD to be able to compare the different projects. If you are interested in an explanation on how I did this, feel free to leave a comment below and I might consider recording a video about it.
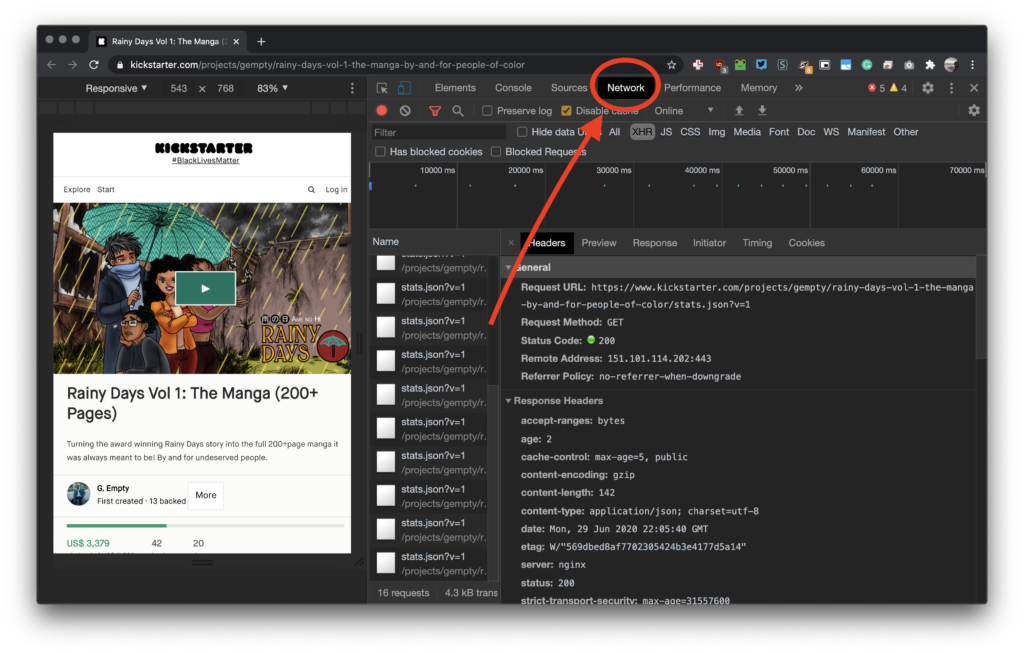
Now, I promised I would show you how I figured to retrieve dynamic data with IMPORTXML. The first step in order to do this is to “monitor” the data packets sent by the server of the webpage to our browser. Chrome has a wonderful built-in to do so that makes it relatively easy.
After having enabled Javascript again on your project’s webpage, open the Developers module (Right click anywhere and click on “Inspect”) and navigate to the “Network” tab of the module:
Once there, make sure you have “XHR” selected here:
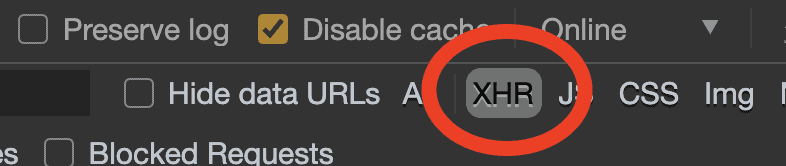
Once this is selected, you should see a list of “stats.json?v=1” lines popping up in the “Name” column. Double click on one of them.
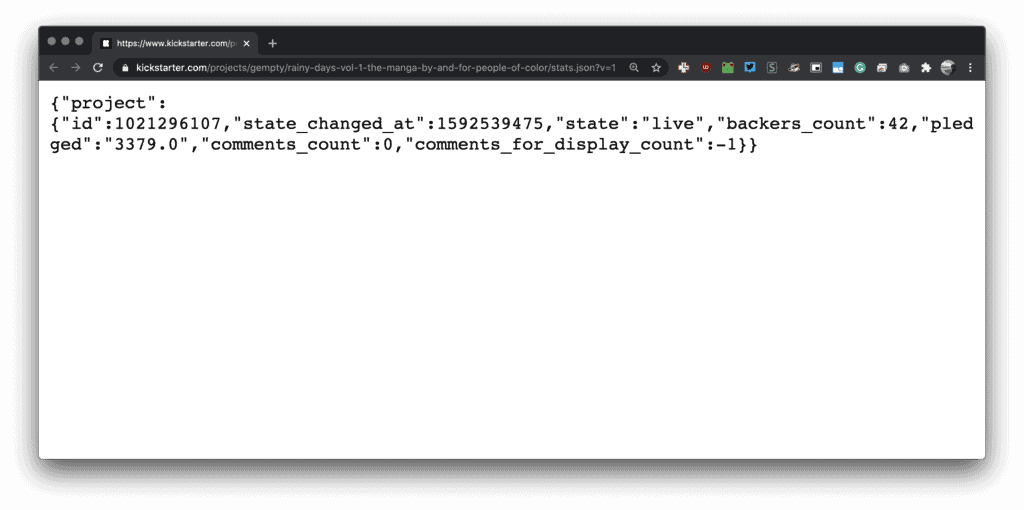
As you can see, the URL is simply “stats.json?v=1” appended to the original project’s URL.
Also, a lot of the data we were originally interested in is stored in this JSON file. Indeed, we now have access to the amount of backers and the amount of money that has been pledged towards the campaign already.
And just like that, I was able to populate the two other columns that were so important for the success of this tracking/monitoring project.
Using the IMPORTDATA and the INDEX formula, you can see in the spreadsheet I shared how I then was able to clean this output and just keep the information I was looking for.
I tried this method on other websites and it mostly works. If the JSON file you are interested in querying is big, it then starts to become a real pain to decode and clean but if it’s a small JSON file like in Kickstarter, then it is really not that hard to clean and use within Google Sheets.
And that’s pretty much it for this article. There is one thing I would like to share. I just opened Martech with Me’s Youtube channel and posted my first video over there. For now, my goal is to go through the most-read articles on this blog and convert their content into a video-friendly format. So if you are more interested in video tutorials over text-only tutorials, please do check it out at this link: https://www.youtube.com/channel/UC5aF3ghWsEoO8VMajaQ9d-g/
And if you want a video version of this article, please do request it in the comments down below and I will record it :).
Thank you for your time,